 First principles:
Sonotrodes (ultrasonic horns) and boosters are special tools designed so that their natural vibrations (resonance) form a defined mode shape at a particular frequency. The simplest example is the axial-mode half-wavelength sonotrode. Axial-mode refers to the predominant direction of vibrational movement - along the axis of the sonotrode. Half-wavelength describes the variation of vibration amplitide along the length - at a maximum at both ends with a point of zero (axial) motion in the middle.
Choice of operating frequency:
Ultrasonic equipment is available in a wide range of operating frequencies but each item of equipment is almost invariably set to a single operating frequency and allows only a very narrow tolerance for variations, perhaps a few hundred Hz.
So if you already have equipment operating at, say, 20kHz +/- 200Hz, you must design and manufacture your sonotrodes to resonate at a frequency in the range 19800 to 20200 Hz. If you haven't yet specified your equipment, lower frequencies will give larger sonotrodes with greater power handling capacity while higher frequencies lead to smaller sonotrodes that may be better suited to fine work. The lower limit on ultrasonic frequencies is generally taken as around 18 to 20kHz. Frequencies lower than this can be painfully audible to the human ear.
Design process:
So the aim is to create a design that meets any specific requirements of your process and is resonant in the desired mode of vibration at the nominal working frequency. The design process to achieve this in SonoAnalyzer, as with other numerical tools, is based on trial and error. You choose a design to start with based on experience (or just pure guesswork - the starting point doesn't really matter) and:
- In SonoAnalyzer, calculate all its resonant modes and frequencies,
- By examination of the mode shapes, decide which resonance mode will work best for your application (commonly the half-wavelength axial mode as discussed above).
- Check the resonant frequency of this mode - do you need to adjust it up or down to suit the working frequency of your equipment?
- If adjustment is required, change a dimension accordingly. For axial modes the length of the sonotrode is most important - increasing length will reduce the resonant frequency, and vice versa. For example in some designs increasing the length by 1 mm may reduce the frequency by about 150 Hz. This does vary for different sonotrodes so treat it just as an initial figure - use your own results to find a suitable value for each new design.
- Repeat the process from step 1 with the new dimensions, until you end up with a design that puts your chosen mode at the desired working frequency.
This is very much like the real-life process of designing sonotrodes (without any computer aids) except that:
- It's much faster and cheaper to test new designs in a computer than to manufacture and test a real, physical sonotrode.
- You can see the modes of vibration, which helps in understanding which one(s) will work for your process.
Automated frequency tuning:
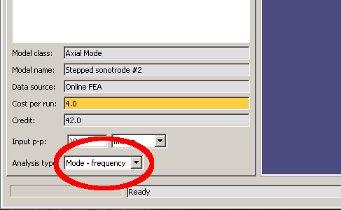 Depending on the version and model chosen, SonoAnalyzer may offer to automate the frequency-tuning process described above. If available this is shown at the foot of the Analysis tab - a selection box offering "Mode - frequency" (the default) or "Auto tuning". When Auto tuning is used, the frequency display on the Dimensions tab becomes writable, and this is used to set the required working frequency. In SonoAnalyzer OE, the only models that offer auto tuning are the database-backed ones, ie. those with "Online database" in the title. These database-backed models produce answers very quickly but are also inherently rather limited. The other models (labelled "Online FEA") are far more versatile because they perform a full FEA analysis of the exact model requested by the user but this also makes them slower, often taking 30 seconds to a minute or more per analysis run. For this reason the auto-tuning option is not available on Online FEA models - in the current state of computer technology, multiple repeated FEA analyses are not suitable for a shared environment. However this is planned for SonoAnalyzer Pro where an analysis server can be dedicated to a single user.
Alternative resonance modes:
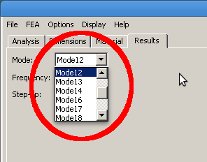 Sonotrodes are sometimes considered in a simplistic way to have only one mode of vibration at a single frequency - the working frequency. In reality this is always false - any sonotrode will have an infinite number of different modes and frequencies, some of which (those towards the lower end of the frequency range, or close to the working frequency) should definitely be considered as part of the design process. As discussed above, SonoAnalyzer does not limit its analysis to any one mode - its results include the first 10 - 20 modes of the frequency range so that the user can evaluate them individually.
 Some of these other modes may be valuable alternative working modes, eg. the full-wavelength axial mode (as the name implies, effectively two half-wavelength sonotrodes joined together). In this case it's up to the user to decide which mode to use and hence which resonant frequency should be adjusted.
 Most other modes are not useful, however, and involve motion that will not naturally be excited by a typical axial-mode transducer. ie. at the point of attachment the direction of motion is lateral or torsional, which a regular transducer should not be able to drive. These are generally of academic interest only - "Mostly Harmless"! (Some torsional-mode ultrasonic systems do exist though, and the more recently-developed SonoAnalyzer models can be used to design sonotrodes for them.)
However in some cases (mostly more complex designs like blocks and rings), alternative modes exist that:
- Can be driven by the transducer.
- Do not have a useful modeshape for the process (bad amplitude distribution).
- Appear at a frequency close to the working frequency.
Such modes can severely compromise the sonotrode design, potentially making it completely useless. SonoAnalyzer allows users to predict such problem modes and alter the design to move their frequencies either up or down, away from the working frequency. A separation of 1 to 2kHz is usually enough to prevent interference.
Step-up ratio:
 Sonotrodes are often designed to amplify the vibration amplitude as a part of their design; boosters may have this as their sole function. So for example, if a transducer which delivers an amplitude of 10 microns is fitted to the input of a 2:1 booster, the amplitude at the output of the booster will be 20 microns. So the "step-up" is the ratio of output to input amplitude.
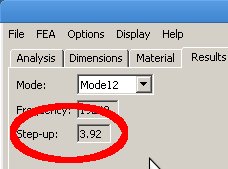
For a few specific profiles, the step-up ratio can be easily calculated. eg. a straight cylindrical sonotrode will always have a 1:1 ratio, a simple stepped sonotrode will have a step-up proportional to the inverse of the area ratio (diameter squared), and a pure exponential sonotrode will have a step-up proportional to the inverse of the diameter ratio. However for sonotrode profiles in general these simple calculations are inadequate and numerical analysis is required. SonoAnalyzer shows the step-up ratio on the Results tab, just under the resonant frequency for each mode of vibration. The figure will usually be relevant only for the chosen, working mode.
Some boosters are reversible and in this case the step-up ratio is inverted - a 2:1 booster in reverse will work as a 1:2 step-down, or a step-up of 0.5. In SonoAnalyzer the input is typically at the top of the sonotrode diagram in the Dimensions tab and the output at the bottom. To avoid confusion while viewing the 3D display (which can be rotated to any orientation) the input surface is shown by a green-coloured region and the output is shown in orange. Some models have restrictions on geometry such that the output is always smaller (or at least, no bigger) than the input, so the step-up ratio will always be greater than or equal to one. If a step-down sonotrode is to be designed, this can still be achieved by designing the inverse (step-up) sonotrode and reversing the input / output faces.
Stress and amplitude:
 Stress is critical to the design of sonotrodes. In many cases end-of-life is caused by fatigue cracks at the highest-stress locations. In SonoAnalyzer stresses are displayed individually for each mode on request. Select your chosen working mode and then from the menu choose FEA -> Download Stress Plot. The stress plot (a direct output from the Finite Element program) opens in a new tab. The plot shows the distribution of von Mises stress - a commonly-used value computed from the stress tensor which indicates where yield or fracture is most likely. In ultrasonic systems the number of vibration cycles mounts up very quickly (eg. a million cycles in only 50 seconds of operation at 20kHz) so fatigue is the most likely mode of failure and stress must be kept below the fatigue limit for the material used. On examination of the stress plot the designer should consider:
- The maximum value of stress, shown as "max" towards the top-left of image (units are SI, so stress in Pascals).
- The location of the maximum stress. Can the design be changed to improve this? Surface treatment (peening / polishing) may be used in that region to improve durability and the more advanced profiles (eg. exponential) will often take some of the peaks out of the stress distribution, compared to a simple stepped sonotrode.
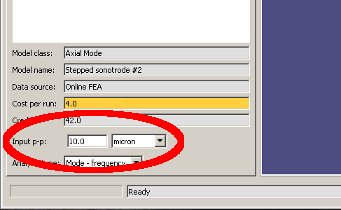 The vibration amplitude is also a direct factor in generating stress. Input amplitude is set by the user on the Analysis tab ("Input p-p"). This peak-to-peak value of displacement is commonly used in the ultrasonics industry and often misnamed "amplitude peak-to-peak". Engineers and physicists new to this industry should note that this is double the true amplitude as defined in physics textbooks - measured from mid-point to peak).
 at the input and 20 micron amplitude (40 p-p) at the output. This stepped sonotrode has a 4:1 step-up ratio. (Click to enlarge)") Amplitude distribution is also important to the correct functioning of ultrasonic equipment. The step-up ratio has already been discussed but that is a single figure based on average amplitude - in the case of larger sonotrodes, particularly blocks, the amplitude may vary considerably across the output surface, to the detriment of the process. Contour plots of displacement and axial-displacement (which considers only the component of displacement in the axial direction) display the variation in amplitude across the entire sonotrode.
Amplitude distribution is also important to the correct functioning of ultrasonic equipment. The step-up ratio has already been discussed but that is a single figure based on average amplitude - in the case of larger sonotrodes, particularly blocks, the amplitude may vary considerably across the output surface, to the detriment of the process. Contour plots of displacement and axial-displacement (which considers only the component of displacement in the axial direction) display the variation in amplitude across the entire sonotrode.
SonoAnalyzer OE offers static plots (no rotation, zoom etc.) of von Mises stress, amplitude contour plots for displacement and axial displacement, and an animated image from the FEA program (mainly for confirmation of the SonoAnalyzer 3D image). SonoAnalyzer Pro will offer the same plus direct interaction with the FEA postprocessor, allowing the user to rotate the model, zoom, pan and use a variety of advanced options.
Worked examples:
Coming soon - worked examples of common sonotrode designs based on the principles described above.